 SEGLY
SEGLY
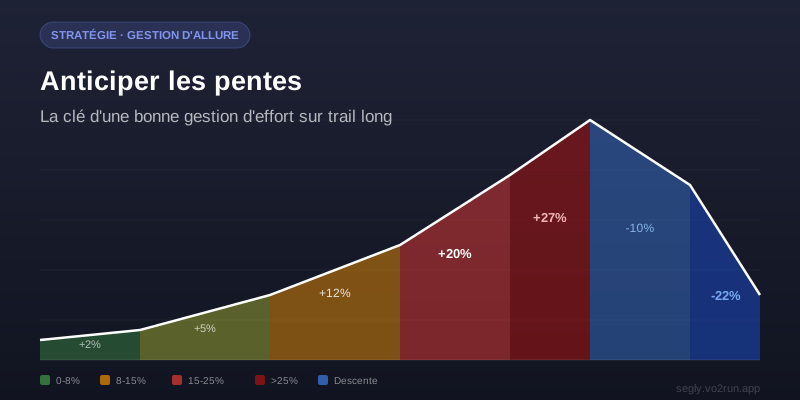
The day before a trail run, many runners open their GPX file, look at the elevation profile—a curve going up, a curve going down—and close the screen, thinking they’ve done their homework. But looking at a curve isn’t the same as reading it. And if you don’t read it, you run the risk of starting out at a pace that will burn you out three hours later, when you hit a wall you didn’t see coming. Anticipating slopes means turning abstract data into a concrete action plan: knowing when to run, when to walk, where to conserve energy, and where to let loose. This is the foundation of any serious trail running pace management—and one of the most underrated skills among runners of all levels. In this article, we’ll explain how to read a trail race profile, which thresholds to watch for, and how to turn it into a real strategy for your next long trail run.
Why Grade Is the No. 1 Variable in Trail Running
On the road, pace management is relatively simple. You know your cruising speed, you maintain it, and your body adapts to it. The terrain is flat and predictable. In trail running, this logic breaks down as soon as grade comes into play—and grade is everywhere.
The relationship between grade and speed isn’t linear: it breaks down beyond a certain threshold. A runner capable of maintaining 12 km/h on flat ground may drop to 4 km/h on a 25% climb. This isn’t a sign of weakness; it’s physics. With every additional degree of incline, the energy required to propel yourself increases, while the vertical component absorbs a growing share of the effort. Beyond a certain threshold, running becomes less efficient than walking fast—and the best trail runners know this all too well.
The direct consequence: if you don’t know the precise distribution of slopes on your route, you’ll be managing your effort blindly. You might start out too fast on a segment that looked runnable based on the overall profile, only to find yourself exhausted at the foot of a steep climb you hadn’t anticipated. Misjudging a slope often compromises the entire rest of the race. A thorough GPX trail analysis starts exactly there: not with the total elevation gain, but with the precise distribution of slopes, segment by segment.
The Gradient Thresholds You Need to Know
Every runner reacts differently to inclines depending on their fitness level and body type, but there are behavioral thresholds that apply to the vast majority of trail runners. Knowing them means you can intelligently plan your run/walk transitions even before setting foot on the course.
- 0 to 3%: nearly flat. Your pace remains close to that on flat ground, and the cardiovascular effort is minimal. You run naturally, at your cruising pace.
- 3–8%: gentle climb. You can still run efficiently, but the effort is noticeable. Starting at 5–6%, a short stride and leaning your torso forward become natural.
- 8–15%: Steady climb. This is the tipping point. For many runners, brisk walking becomes just as viable as running. Cardiovascular exertion increases significantly, and pushing too hard here will take a heavy toll later on.
- 15 to 25%: Steep climb. Walking is almost inevitable, even for trained runners. Running this slope requires a disproportionate energy expenditure relative to the time saved—dynamic walking is almost as fast, at a fraction of the cardiovascular effort.
- Over 25%: very steep section. Slow walking; the use of poles is almost mandatory, sometimes requiring four points of contact on the most extreme sections. Progress is very slow, regardless of your current fitness level.
The same logic applies on descents. Beyond a -15% gradient, maintaining control becomes more challenging. Beyond a 20% decline, the quadriceps work in intense eccentric contraction—this type of effort is particularly damaging to muscle fibers, and the accumulated muscle fatigue will catch up with you on subsequent climbs. Your descent speed plateaus despite the slope, especially if the terrain is technical or wet.
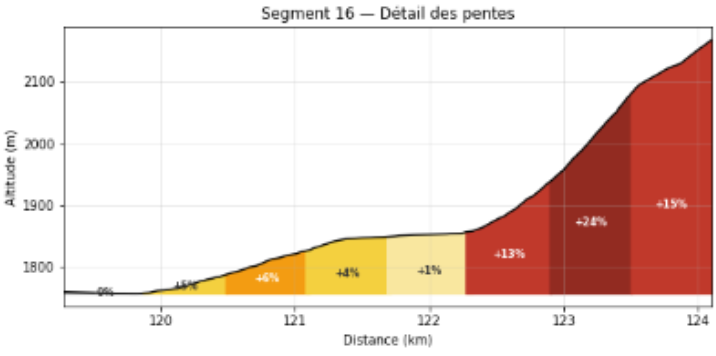
Example of an uphill segment analyzed by Segly: each section is color-coded based on the steepness of the slope, with the exact percentage displayed. You can immediately identify the target running/walking zones.
The Pitfall of Misinterpreting a GPX Profile
A standard GPX profile is an overall elevation curve. It gives you an idea of the general shape of the route, but it smooths out the finer variations. Two segments with the same total elevation gain can have radically different profiles—and very different impacts on your run.
Let’s take a concrete example: a 5-km segment with 400 m of elevation gain. In one scenario, it’s a steady 8% climb all the way—steep but manageable and predictable. In the other scenario, it’s 3 km of a 2–3% false flat followed by 2 km at 20%. The total elevation gain is exactly the same. But the actual completion time will be very different, and, more importantly, the pacing strategy will not be the same: in the first case, you can maintain a steady pace; in the second, you’ll need to conserve energy over the first 3 km to have enough in your legs for the last 2.
Without detailed information on the trail’s gradient, we systematically underestimate the occasional steep sections hidden within a flattering average. You start too fast before a difficult section, arrive exhausted at the base of a steep climb, and your effort meter spikes at exactly the worst possible moment. The overall trail elevation profile is useful for the big picture—but it’s not enough to build a robust strategy for a long trail race.
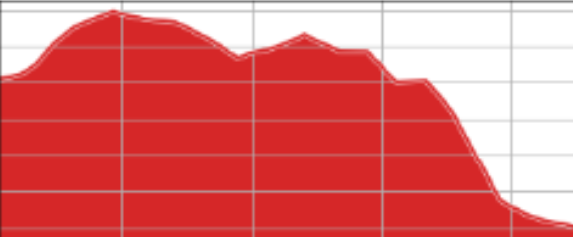
Overview of a segment: the uniform color doesn’t reveal internal variations. Sudden steep sections remain hidden behind the overall curve.
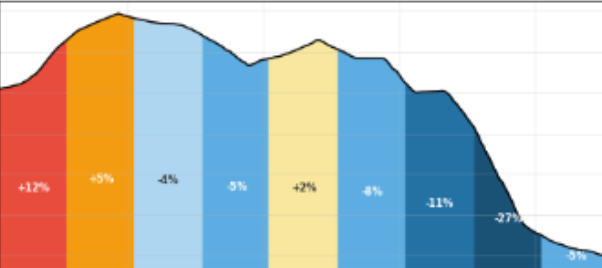
The same segment with slope details enabled. The ascents, descents, and flat sections in between are clearly visible, with precise gradients for each zone.
How to Turn This Data Into a Race Strategy
Knowing the gradient thresholds is one thing. Using them to build a real race strategy is another. Here’s a four-step method for turning gradient details into concrete pacing decisions:
- Identify the segments where the gradient exceeds 15%: these are your run/walk transition points. Note their location on the course—especially in relation to aid stations and the preceding sections.
- Mentally prepare for these sections: knowing that a 20% climb is coming at the 34 km mark changes how you approach the 30 km mark. This mental preparation has real physiological benefits—you’re no longer just enduring; you’re executing a plan.
- Adjust your pace in advance: if a steep climb is coming up in 3 km, this isn’t the time to push too hard. The kilometers leading up to a climb are the most effective for conserving energy. Arrive fresh at the base of the climb, not completely drained.
- On steep descents: when the gradient exceeds -20%, consciously slow down. Your quadriceps are a precious resource—every steep descent strains them through eccentric contraction. Don’t waste them at the start of the race.
With Segly: the trail elevation profile graph colors each section from blue (steep descent) to dark red (steep climb), with the exact percentage displayed for each zone. You can see at a glance where the real “walls” of your race are—well beyond the overall curve. The free trail GPX analysis is available without an account at segly.vo2run.app.
Anticipating isn’t just a matter of your legs
Grade is the main variable, but it’s never the only one. An 18% climb in 30°C heat doesn’t take the same physiological toll as the same grade at 14°C under overcast skies. The heat forces your body to expend energy to regulate its temperature, in addition to the effort required to propel yourself forward. The result: you’ll feel exhausted much more quickly on the same segment, with slower recovery between efforts. To learn more about this topic, the article on weather as part of race analysis details how these variables add up.
A technical descent in the rain requires more caution and takes longer than a descent in dry weather. Your brain works harder, and so do your stabilizing muscles. In ultras, this additional neuromuscular load builds up silently and eventually takes its toll in the final kilometers.
And then there’s your position in the race. Tackling an 18% grade at the 70-km mark, with 3,500 m of elevation gain already in your legs, is absolutely not the same as doing so at the 10-km mark. Cumulative fatigue shifts your run/walk threshold—what you were running at a 10% grade at the 15-kilometer mark might end up being walked at the 80-kilometer mark. This is precisely what effort management in long-distance trail running models: not a uniform decline, but an interaction between slope, cumulative fatigue, and external conditions.
A concrete example: analyzing a segment before the race
Let’s take a fictional but representative example of a mountain ultra: 13 km between two aid stations, with a total elevation gain of 1,247 m.
View of the overall GPX profile: a general climb, appearing fairly steady. One might naively estimate 1 hour 45 minutes to 2 hours, depending on fitness level. The curve reveals nothing more.
View showing slope details: the first 4 kilometers are actually a false flat at 2–4%—fast-paced and manageable at race pace. Then the next 9 km climb gradually, with a final 1.5-km wall at +18% just before the aid station. The total elevation gain is the same—but the structure calls for a radically different strategy.
What this means in practice:
- The 4 km of gentle incline are an opportunity for active recovery—not a time to speed up just because the slope seems mild.
- The final 1.5 km climb at 18% will be tackled by walking by the vast majority of runners. Anticipating it means not getting caught off guard and conserving energy.
- The classic mistake without this analysis: starting out too fast on the 4 km of false flat and arriving exhausted at the base of the wall, unable to maintain even a brisk walk.
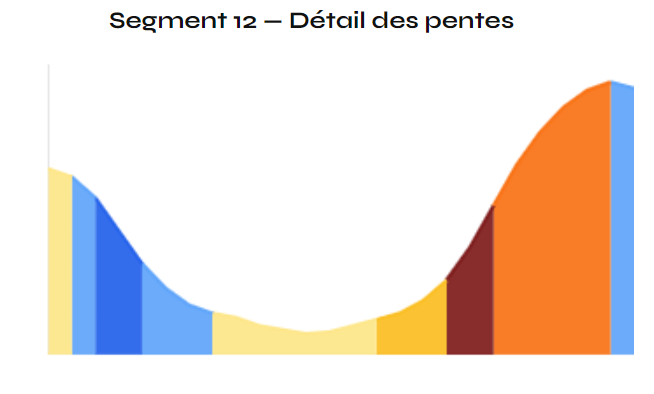
The gradient graph for a complex segment: initial descent, valley floor crossing, final climb. Impossible to interpret from an overall elevation profile—yet essential for planning your effort.
Common Mistakes to Avoid
Managing your pace on a trail is an art that’s often learned the hard way. Here are the 5 most common mistakes in long-distance races:
- Focusing on the total elevation gain without looking at the distribution: 4,000 m spread evenly over 100 km doesn’t cause the same fatigue as 4,000 m concentrated over 40 km. The total is misleading without a segment-by-segment breakdown.
- Underestimating isolated steep sections hidden within a flattering average: A segment listed as having an 8% average grade may hide a 25% climb over 500 m—completely invisible in the average, but very real on the trail.
- Starting too fast before a difficult segment: The euphoria of the start and the confidence of the first few hours naturally push you to push too hard. This is exactly what you need to avoid—especially right before a steep climb.
- Underestimating the impact of steep descents on the quadriceps: A descent with a 20% grade wears down the quadriceps through eccentric contraction. This specific muscle fatigue takes its toll on climbs in the hours that follow.
- Ignoring the interaction between grade, cumulative fatigue, and weather: each variable amplifies the others. An 18% hill at the 80 km mark in hot weather is a completely different experience from the same hill at the 10 km mark in cool weather.
Conclusion
Grade isn’t just a technical statistic—it’s key to managing the race mentally and physically. Knowing how to read it means anticipating the tough moments before they hit you. It means conserving your energy for the right moments, adjusting your pace proactively rather than reactively, and approaching the end of a long trail run with something left in your legs.
Whether you’re preparing for your first ultra or your tenth mountain race, a detailed analysis of the trail’s elevation profile is an investment of just a few minutes that can completely transform your racing experience. The overall curve tells you where you’re going. The details of the gradients tell you how to get there—and it’s this difference that separates a race you control from one you’re merely enduring. Also discover how to calculate your split times in an ultra-trail to turn this analysis of the gradients into a complete race plan.
Upload your GPX file to segly.vo2run.app and enable slope details to see each section colored from blue for descents to red for steep climbs—with the exact percentage for each zone. Your race strategy starts here.